
In this post, I will discuss in some detail the rationale and goals of the design of the Social Network Benchmark (SNB) and explain how it relates to real social network data as in Facebook, and in particular FaceBook’s own graph benchmark called LinkBench. We think SNB is the most intricate graph database benchmark to date (it’s also available in RDF!), that already has made some waves. SNB recently received praise at the most important database systems conference SIGMOD in Snowbird after being used for this year’s ACM SIGMOD Programming Contest, which was about graph analytics.
SNB is intended to provide the following value to different stakeholders:
-
For end users facing graph processing tasks, SNB provides a recognizable scenario against which it is possible to compare merits of different products and technologies. By covering a wide variety of scales and price points, SNB can serve as an aid to technology selection.
-
For vendors of graph database technology, SNB provides a checklist of features and performance characteristics that helps in product positioning and can serve to guide new development.
-
For researchers, both industrial and academic, the SNB dataset and workload provide interesting challenges in multiple technical areas, such as query optimization, (distributed) graph analysis, transactional throughput, and provides a way to objectively compare the effectiveness and efficiency of new and existing technology in these areas.
I should clarify that even though the data model of SNB resembles Facebook (and we’re extending it to also look more like Twitter), the goal of SNB is not to advise Facebook or Twitter what systems to use, they don’t need LDBC for that. Rather, we take social network data as a model for the much broader graph data management problems that IT practitioners face. The particular characteristic of a graph data management problem is that the queries and analysis is not just about finding data by value, but about learning about the connection patterns between data. The scenario of the SNB, a social network, was chosen with the following goals in mind:
-
the benchmark scenario should be understandable to a large audience, and this audience should also understand the relevance of managing such data.
-
the scenario in the benchmark should cover the complete range of challenges relevant for graph data management, according to the benchmark scope.
-
the query challenges in it should be realistic in the sense that, though synthetic, similar data and workloads are encountered in practice.
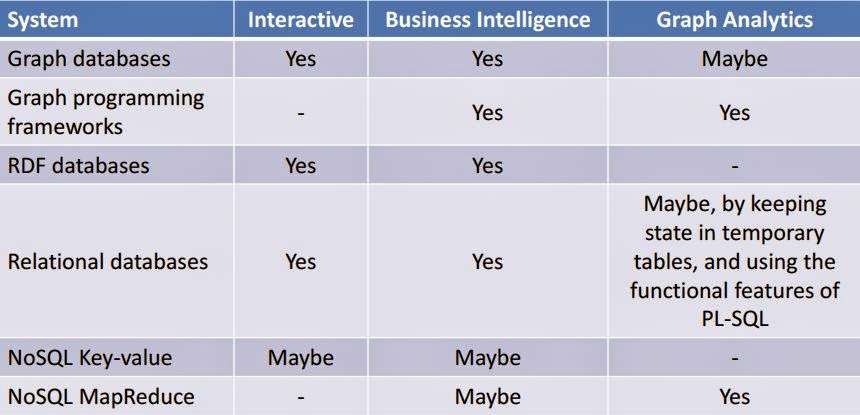
The SNB is in fact three distinct benchmarks with a common dataset, since there are three different workloads. Each workload produces a single metric for performance at the given scale and a price/performance metric at the scale. The full disclosure further breaks down the composition of the metric into its constituent parts, e.g. single query execution times.
-
Interactive Workload. The Interactive SNB workload is the first one we are releasing. It is defined in plain text, yet we have example implementations in Neo4j’s Cypher, SPARQL and SQL. The interactive workloads tests a system’s throughput with relatively simple queries with concurrent updates. The system under test (SUT) is expected to run in a steady state, providing durable storage with smooth response times. Inserts are typically small, affecting a few nodes at a time, e.g. uploading of a post and its tags. Transactions may require serializability, e.g. verifying that something does not exist before committing the transaction. Reads do not typically require more than read committed isolation. One could call the Interactive Workload an OLTP workload, but while queries typically touch a small fraction of the database, this can still be up to hundreds of thousands of values (the two-step neighborhood of a person in the social graph, often). Note that in order to support the read-queries, there is a lot of liberty to create indexing structures or materialized views, however such structures need to be maintained with regards to the continuous inserts that also part of the workload. This workload is now in draft stage, which means that the data generator and driver software stack are ready and the purpose is to obtain user feedback, as well as develop good system implementations. The first implementations of this workload are now running on Openlink Virtuoso, Neo4j and Sparsity Sparksee, and we are eager to see people try these, and optimize and involve these.
-
Business Intelligence Workload. There is a first stab at this workload formulated in SPARQL, tested against Openlink Virtuoso. The BI workload consists of complex structured queries for analyzing online behavior of users for marketing purposes. The workload stresses query execution and optimization. Queries typically touch a large fraction of the data and do not require repeatable read. The queries will be concurrent with trickle load (not out yet). Unlike the interactive workload, the queries touch more data as the database grows.
-
Graph Analytics Workload. This workload is not yet available. It will test the functionality and scalability of the SUT for graph analytics that typically cannot be expressed in a query language. As such it is the natural domain for graph programming frameworks like Giraph. The workload is still under development, but will consist of algorithms like PageRank, Clustering and Breadth First Search. The analytics is done on most of the data in the graph as a single operation. The analysis itself produces large intermediate results. The analysis is not expected to be transactional or to have isolation from possible concurrent updates.
All the SNB scenarios share a common scalable synthetic dataset, generated by a state-of-the-art data generator. We strongly believe in a single dataset that makes sense for all workloads, that is, the interactive and BI workloads will traverse data that has sensible PageRank outcomes, and graph clustering structure, etc. This is in contrast to LinkBench, released by the team of Facebook that manages the OLTP workload on the Facebook Graph, which closely tunes to the low-level MySQL query patterns Facebook sees, but whose graph structure does not attempt to be realistic beyond average out degree of the nodes (so, it makes no attempts to create realistic community patterns or correlations) . The authors of LinkBench may be right that the graph structure does not make a difference for simple insert/update/delete/lookup actions which LinkBench itself tests, but for the SNB queries in the Interactive and BI workloads this is not true. Note that Facebook’s IT infrastructure does not store all user data in MySQL and its modified memcached ("TAO"), some of it ends up in separate subsystems (using HDFS and HBase), which is outside of the scope of LinkBench. However, for queries like in the SNB Interactive and BI workloads it does matter how people are connected, and how the attribute values of connected people correlate. In fact, the SNB data generator is unique in that it generates a huge graph with correlations, where people who live together, have the same interests or work for the same company have greater chance to be connected, and people from Germany have mostly German names, etc. Correlations frequently occur in practice and can strongly influence the quality of query optimization and execution, therefore LDBC wants to test their effects on graph data management systems (the impact of correlation among values and structure on query optimization and execution are a “choke point” for graph data management system where LDBC wants to stimulate innovation).