As discussed in previous posts, one of the features that makes Datagen more realistic is the fact that the activity volume of the simulated Persons is not uniform, but forms spikes. In this blog entry I want to explain more in depth how this is actually implemented inside of the generator.
First of all, I start with a few basics of how Datagen works internally. In Datagen, once the person graph has been created (persons and their relationships), the activity generation starts. Persons are divided into blocks of 10k, in the same way they are during friendship edges generation process. Then, for each person of the block, three types of forums are created:
-
The wall of the person
-
The albums of the person
-
The groups where the person is a moderator
We will put our attention to group generation, but the same concepts apply to the other types of forums. Once a group is created, the members of the group are selected. These are selected from either the friends of the moderator, or random persons within the same block.
After assigning the members to the group, the post generation starts. We have two types of post generators, the uniform post generator and the event based post generator. Each post generator is responsible of, given a forum, generate a set of posts for the forum, whose authors are taken from the set of members of the forum. The uniform post generator distributes the dates of the generated posts uniformly in the time line (from the date of the membership until the end of the simulation time). On the other hand, the event based post generator assigns dates to posts, based on what we call “flashmob events”.
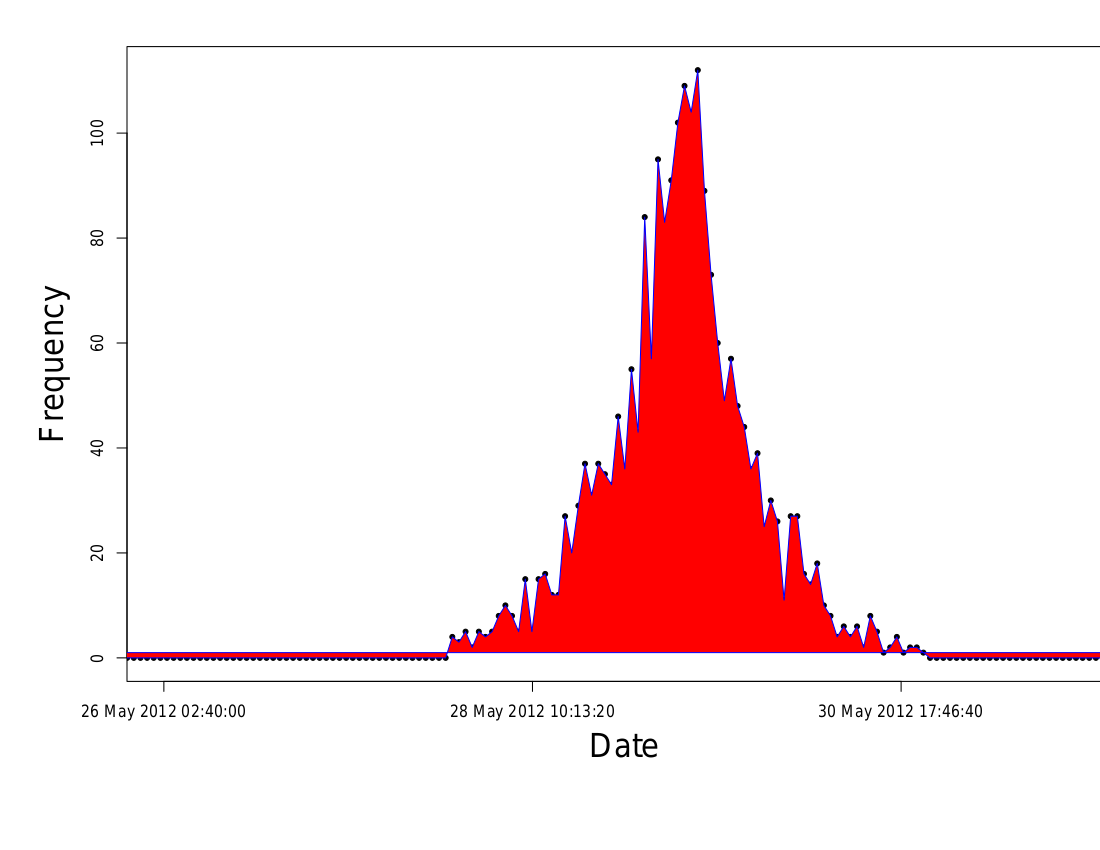
Flashmob events are generated at the beginning of the execution. Their number is predefined by a configuration parameter which is set to 30 events per month of simulation, and the time of the event is distributed uniformly along all the time line. Also, each event has a volume level assigned (between 1 and 20) following a power law distribution, which determines how relevant or important the event is, and a tag representing the concept or topic of the event. Two different events can have the same tag. For example, one of the flashmob events created for SF1 is one related to “Enrique Iglesias” tag, whose level is 11 and occurs on 29th of May of 2012 at 09:33:47.
Once the event based post generation starts for a given group, a subset of the generated flashmob events is extracted. These events must be correlated with the tag/topic of the group, and the set of selected events is restricted by the creation date of the group (in a group one cannot talk about an event previous to the creation of the group). Given this subset of events and their volume level, a cumulative probability distribution (using the events sorted by event date and their level) is computed, which is later used to determine to which event a given post is associated. Therefore, those events with a larger level will have a larger probability to receive posts, making their volume larger. Then, post generation starts, which can be summarized as follows:
-
Determine the number of posts to generate
-
Select a random member of the group that will generate the post
-
Determine the event the post will be related to given the aforementioned cumulative distribution
-
Assign the date of the post based on the event date
In order to assign the date to the post, based on the date of the event the post is assigned to, we follow the following probability density, which has been extracted from [1]. The shape of the probability density consists of a combination of an exponential function in the 8 hour interval around the peak, while the volume outside this interval follows a logarithmic function. The following figure shows the actual shape of the volume, centered at the date of the event.

Following the example of “Enrique Iglesias”, the following figure shows the activity volume of posts around the event as generated by Datagen.

In this blog entry we have seen how datagen creates event driven user activity. This allows us to reproduce the heterogeneous post creation density found in a real social network, where post creation is driven by real world events.
References
[1] Jure Leskovec, Lars Backstrom, Jon M. Kleinberg: Meme-tracking and the dynamics of the news cycle. KDD 2009: 497-506
